


Jaideep Saraswat, Nikhil Mall
India stands at a critical juncture in its energy transition journey, aiming to strike a balance between environmental sustainability and economic growth. A key element of this transformation is the electrification of the transportation sector, backed by an expanding network of charging infrastructure. With a target of achieving at least 30 percent electric vehicle (EV) sales by 2030, it is essential to understand the factors that discourage potential consumers from adopting EVs. Insights from the Deloitte Global Automotive Consumer Survey 2025 reveals that the primary concern for consumers in India centres around the availability and accessibility of charging stations.
In this blog, we delve into state-level data from the Central Electricity Authority (CEA) to examine key dynamics in India’s public EV charging landscape. The analysis focuses on the relationship between:
- The electricity consumed by public charging stations (PCS),
- The number of PCS installed, and
- The total EVs registered in various states.
Although data from all states and union territories are not available, the insights from the existing dataset shed light on critical patterns of infrastructure utilisation and deployment efficiency.
Key Observations and Insights
A comparison of the state-level electricity consumption by PCS with the total number of charging stations is shown in Figure 1. Similarly, the comparison of electricity consumption from charging stations with the total number of registered electric vehicles is illustrated in Figure 2. These illustrations reveal notable insights into the causality between infrastructure, vehicle adoption, and charger utilisation for upcoming EV charging infrastructure deployment.
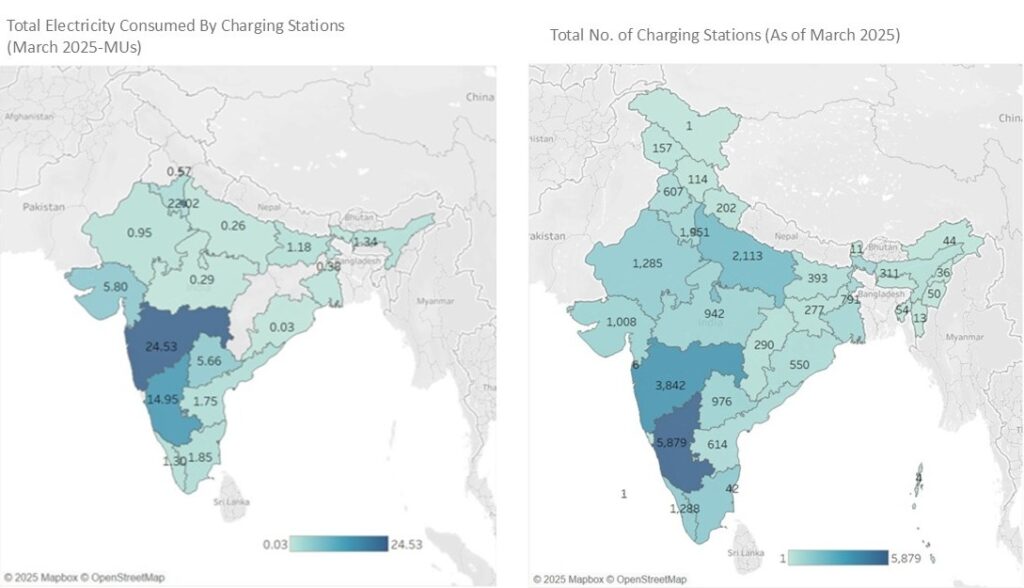
Figure 1: Total Electricity consumed v/s total number of PCS installed
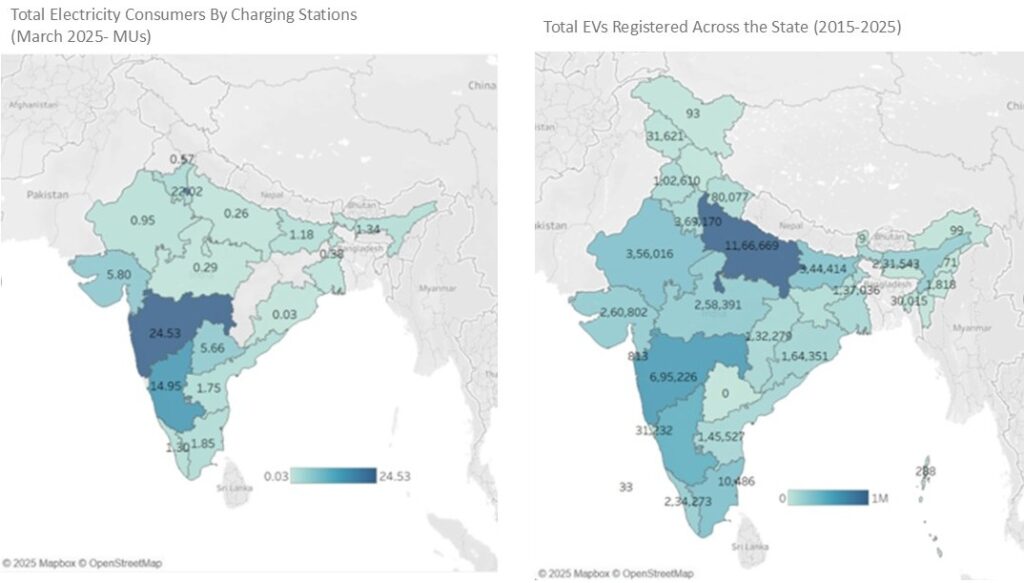
Figure 2: Total electricity consumed v/s total EVs registered
1. Infrastructure vs. Utilisation Mismatch
Karnataka has about 1.5 times more PCS than Maharashtra, yet Maharashtra’s electricity consumption by PCS is significantly higher, as seen in Figure 1. This is attributed to Maharashtra having a larger registered EV base across all segments, as observed in Figure 2. Further, as seen in Figure 3, we observe that the EV strength is concentrated primarily in the two and four-wheeler segments.
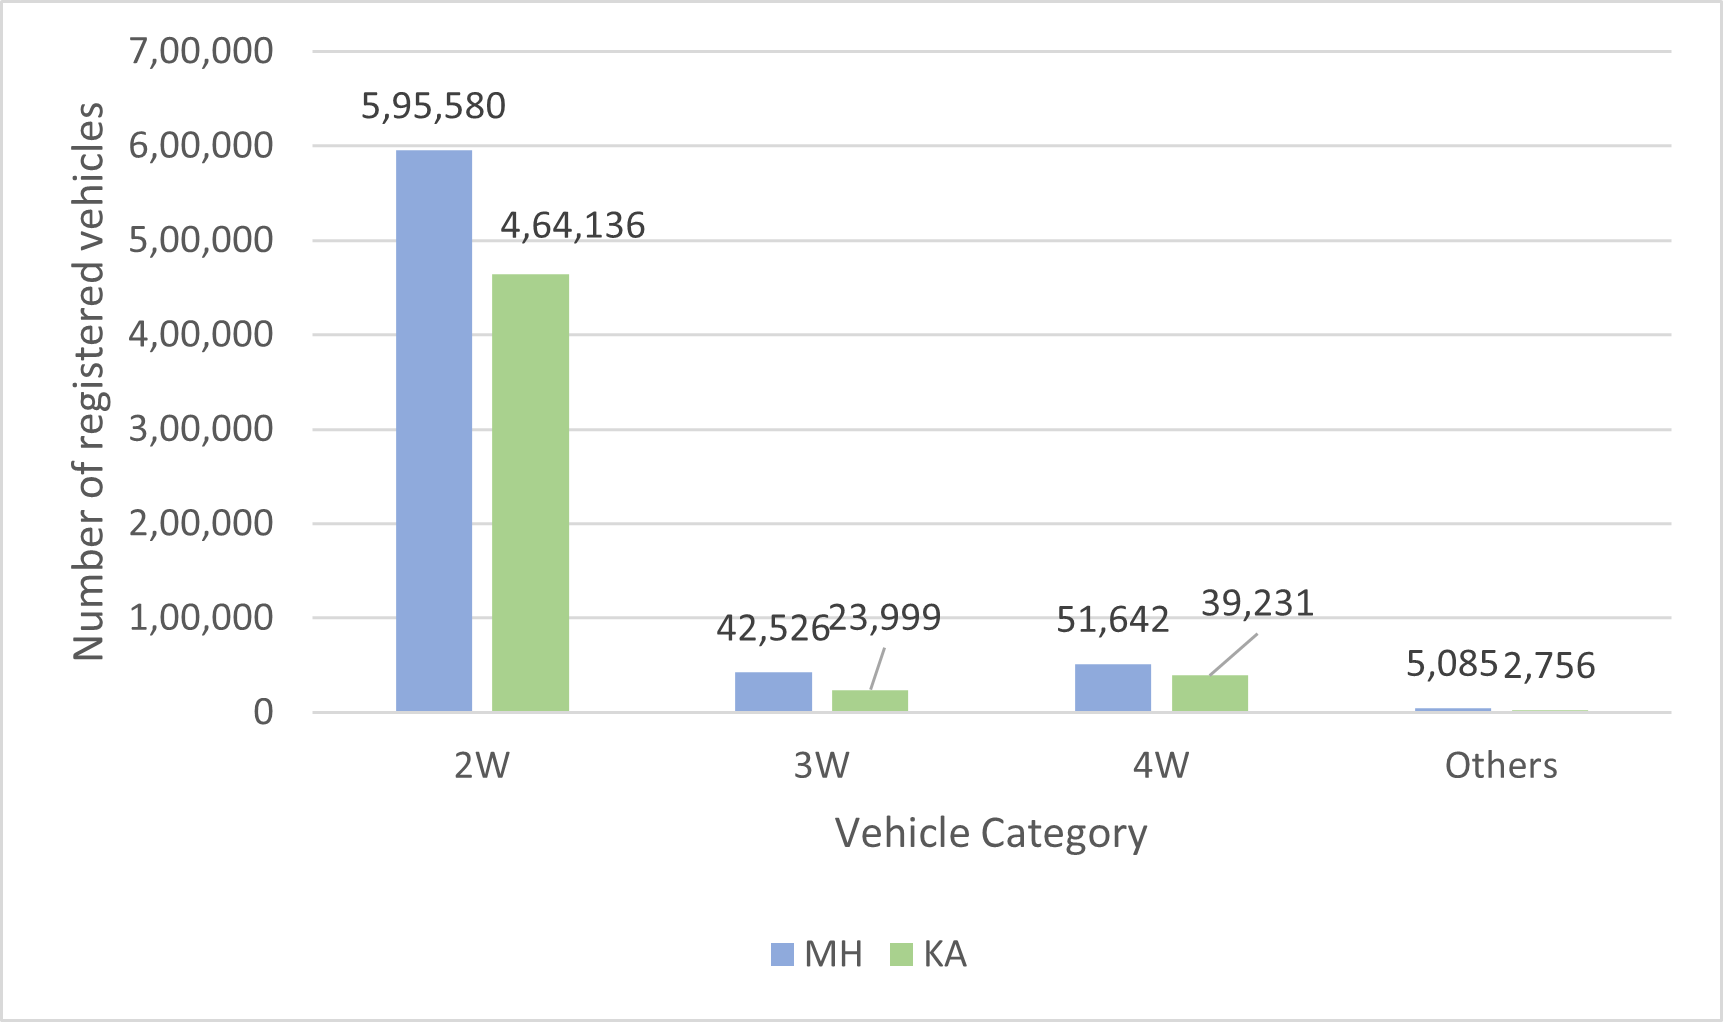
Figure 3: EV registrations across all segments as of March 2025 (Over a decade) (Source)
Charging infrastructure deployment should go beyond simply meeting numerical targets (number of chargers) or following the ‘build it and they will come’ approach. Instead, it should be strategically guided by factors such as vehicle density, the mix of vehicle types, and expected usage patterns. Low utilisation of installed chargers will lead to poor returns on investment and underperformance in operational metrics. This also underscores the need to establish a well-defined taxonomy for PCS, focusing on key metrics such as uptime, reliability, and overall efficiency.
2. High Vehicle Uptake, Low Charger Penetration: The Case of Uttar Pradesh
Uttar Pradesh (UP) leads in the total number of EVs registered, as observed in Figure 2. The EVs are predominantly three-wheelers used for public transport and freight, as seen in Figure 4. Despite being the leader in EV strength, UP has fewer public chargers than both Maharashtra and Karnataka, as inferred from Figure 1. This implies a high likelihood of home-based charging, which is counterintuitive for the three-wheeler segment—especially since these vehicles are primarily used for commercial purposes, such as public or goods transportation, and are expected to spend more time on the road to maximise revenue. Another plausible explanation is that the PCS available may not be compatible with the dominant vehicle segment in the state. These factors further reinforce the need for PCS that are aligned with the specific requirements and usage patterns of local EV users.
Interestingly, concerning charger utilisation, Uttar Pradesh clocked an average of 123 kWh per charger in March. Gujarat, with half the number of chargers and one-fourth the EV volume of UP, sees 5754 kWh per charger, indicating significantly higher utilisation of the existing infrastructure. It is also important to clarify, this does not necessarily imply that vehicles registered in Gujarat belong to higher battery capacity segments. As observed in Figure 4, the distribution of vehicle segments between UP and Gujarat is largely similar across most categories—except for three-wheelers, which shows a significantly higher overall volume.
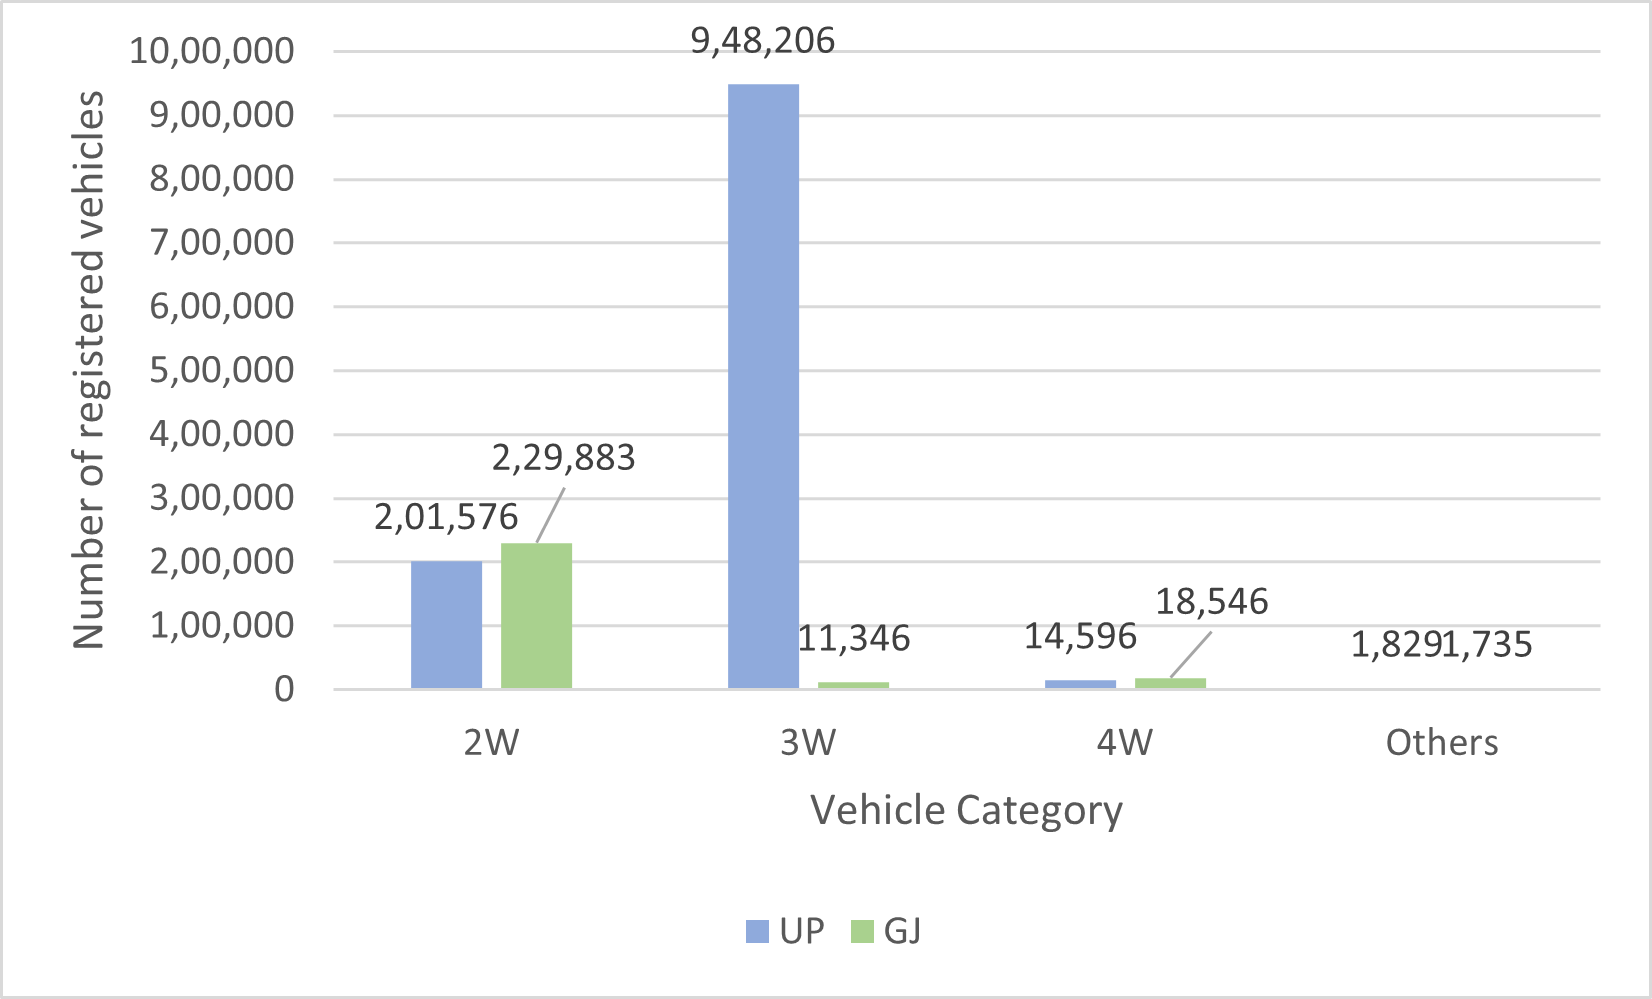
Figure 4: EV registrations across all segments as of March 2025 (Over a decade) (Source)
This showcases that high utilisation in states like Gujarat suggests that chargers are better located. This data-driven examination compels a revaluation of how and where EV charging infrastructure should be deployed. Instead of focusing solely on expanding the number of PCS, emphasis should be placed on strategic site selection—guided by factors such as segment-wise vehicle density, local charging behaviour (home vs. public), and other contextual considerations.
3. State-Level Charging Utilisation Patterns: Delhi vs Karnataka
The monthly electricity consumption and total EV registrations in Delhi and Karnataka from March 2024 to March 2025 have been compared in Figure 5. Delhi has shown consistent growth in EV registrations; however, electricity consumption at PCS has plateaued, suggesting underutilisation of these facilities and a growing preference for home charging. In contrast, Karnataka exhibits a sharp rise in electricity consumption starting November 2024, coinciding with a significant spike in EV registrations. This suggests a rapid increase in charger utilisation and expansion in energy-demanding vehicle segments.
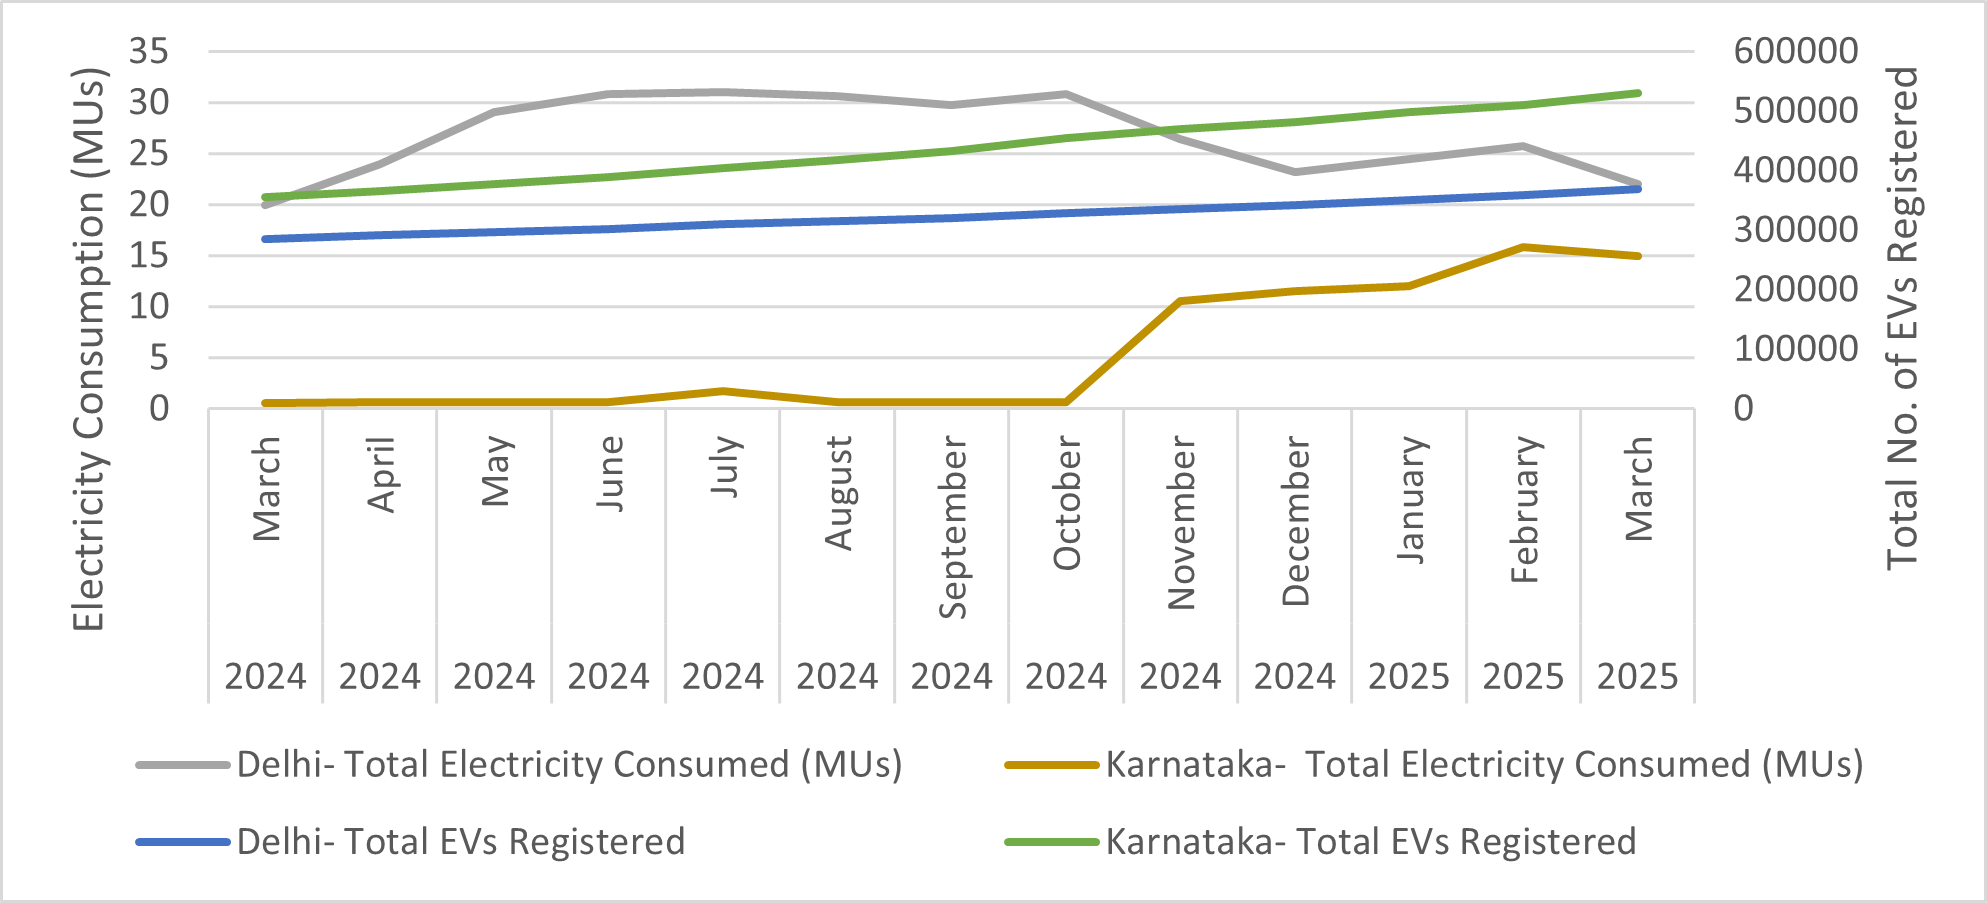
Figure 5: Electricity consumption and EVs registered for Delhi and Karnataka (Source)
This contrast between Delhi and Karnataka highlights the dynamic and context-specific nature of EV charging behaviour. While Delhi’s EV ecosystem is relatively mature, the plateauing utilisation of PCS despite rising EV adoption may imply that simply adding more chargers is unlikely to increase usage. Further expansion may dilute average utilisation rates, leading to inefficiencies and diminishing returns on investment.
Several factors could be contributing to this trend. For instance, existing PCS in Delhi may not be compatible with the dominant vehicle segment in use, or the network may have reached a saturation point—both in terms of geographical density and consumer demand—beyond which additional chargers offer limited incremental value.
In contrast, Karnataka is in a phase of rapid EV growth, with rising demand for public charging infrastructure still outpacing supply. Due to its larger geographic area and higher population, Karnataka is less likely to hit utilisation saturation in the near term, providing more room to expand infrastructure effectively.
Conclusion
This analysis underscores a critical point: EV charging infrastructure should not follow a one-size-fits-all model. Strategic deployment must be informed by local factors such as vehicle segment distribution, charger compatibility, population density, and evolving user behaviour. Regular monitoring of these variables is essential to ensure that charging infrastructure remains responsive to actual demand rather than theoretical targets.
Equally important is the availability of more granular data, which could significantly refine this analysis. First, detailed PCS utilisation data is crucial—it’s possible that some PCS are operating at full capacity, unable to meet local demand, which could explain lower electricity consumption in certain states. Second, reliability metrics are critical to distinguish whether low electricity consumption stems from true underutilisation or extended downtimes. Third, data on charger hogging—where vehicles occupy chargers longer than needed—would help assess whether limited access is suppressing overall utilisation.
Incorporating these additional data layers would provide a more comprehensive and accurate picture of how EV charging infrastructure is performing and where strategic interventions are most needed.